


A fashion retail business—let’s call it Retailer A—observed a decline in revenue compared to previous months. Additionally, some of its products were underperforming, leading to a buildup of unsold inventory in the warehouse. To address this issue, an investigation was conducted by analyzing the business’s historical transaction data. The analysis aimed to yield key insights regarding the measures needed to boost revenue and increase sales of the slow-moving products.
List of Contents
Data Overview
To analyze transaction history, we must first familiarize ourselves with the data. The transaction history dataset to be analyzed consists of 33,343 rows and 8 columns, encompassing 3,414 individual transactions. Given the large number of rows, we are displaying only a portion here. (Note: For readers using a smartphone, text boxes and tables can be scrolled, and images can be enlarged if any content is difficult to read.)
- Date : The date on which the transaction occurred.
- Transaction ID : A unique number that identifies each transaction.
- SKU : A unique identification code assigned to each product name.
- Product : The item being sold.
- Quantity : The number of units of a product purchased in a single transaction.
- Price : The unit price of the product.
- Total Price : Quantity multiplied by price.
In this dataset, a single transaction is not necessarily recorded in a single row. Each row represents a product purchased as part of a transaction; therefore, if a customer buys multiple products in one transaction, these will be recorded across several rows in the dataset.
Data Exploration
Data exploration aims to uncover insights into the data. These insights may take the form of patterns, trends, or relationships within the data that might not be immediately apparent.
-
Monthly Retail Revenue
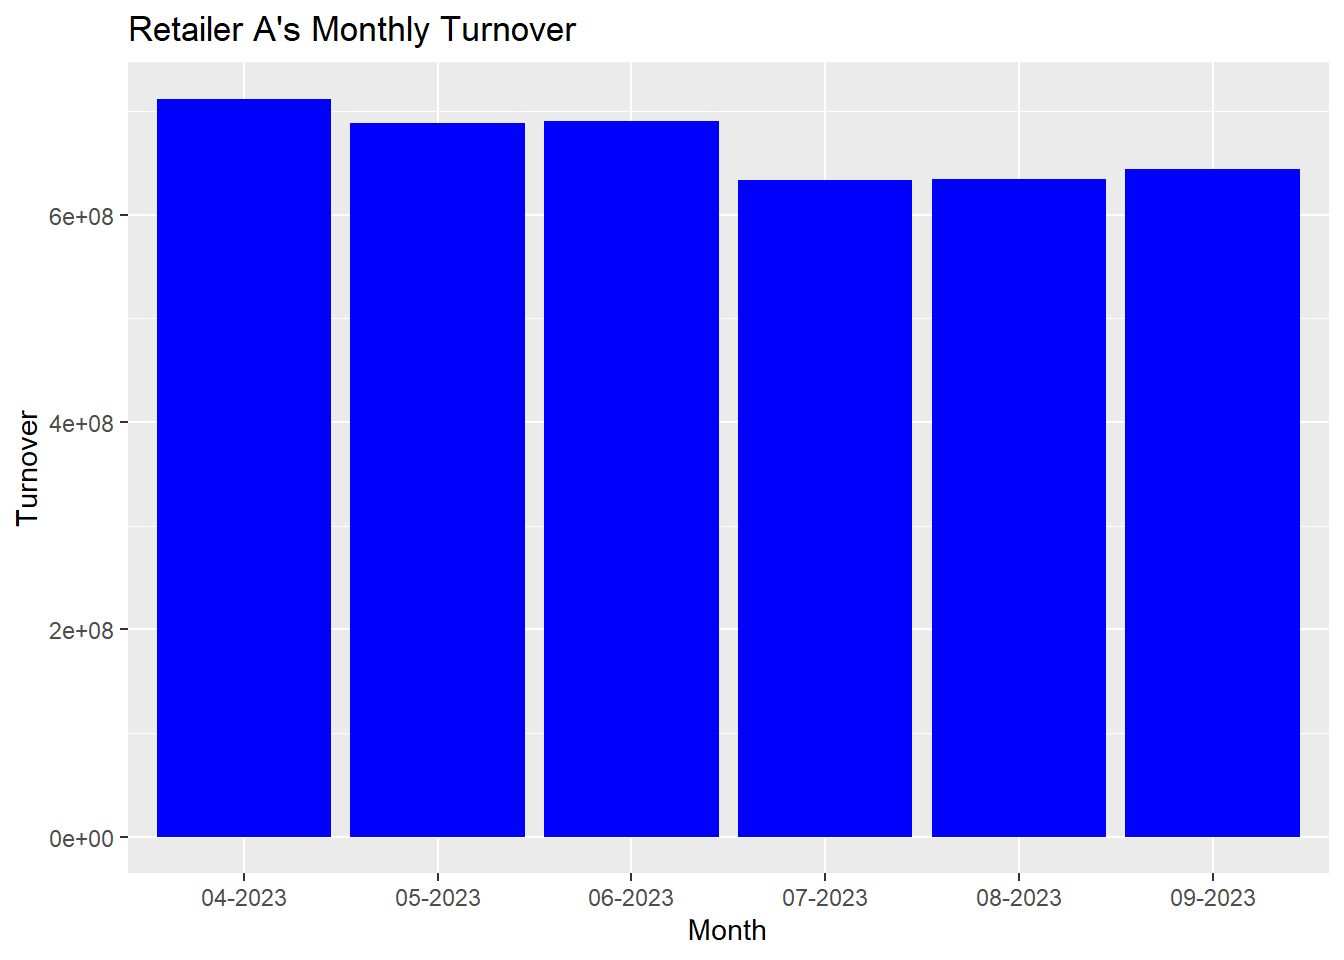
Interpretation : It can be seen that Retail A’s revenue consistently remains above IDR 600,000,000 (6e+08). However, revenue tends to decline rather than increase, which is clearly evident from the revenue reaching IDR 688 million in April but dropping to IDR 625 million by September. A significant drop occurs between June and July, while a significant increase has never occurred. Therefore, it is crucial for Retail A to acquire this Retail Transaction Analysis service in order to find ways to achieve a significant increase in revenue.
-
Remaining Stock by Product
Retailers also have data about the number of product stocks for the last 6 months (April to September 2023). We subtract this data from the number of sales to get remaining stock data.
A large amount of remaining stock for a certain product may indicate that the product is performing poorly in sales. This is evident because upon reviewing the 20 slowest-moving products (lowest sales volume) and the 20 products with the highest remaining stock, there is an 85% (17/20) overlap—meaning 17 products are both among the least sold and have the highest remaining stock. The data is presented below.
                         Product  Sold Quantity  Remaining Stock
                  Wide Leg Pants             25              129
                  Boys' Swimwear             42              124
           Women's Pleated Dress             29              122
                     Moisturizer             62              119
                     Men's Jeans             12              118
       T-Shirt - Striped Pattern             73              115
                    Snapback Cap             13              112
               Girls' School Bag             91              109
                      Hair Tonic            225              108
         T-Shirt - Holiday Theme            163              105
                         Handbag            154              102
                 Girls' Swimwear            167              100
                      Makeup Set            161               99
             Women's Jumbo Jeans            155               97
                 Canvas Tote Bag            186               97
                 Whitening Cream            307               89
                Women's Culottes            215               88
Market Basket Analysis
Market Basket Analysis identifies relationships between products so that poorly selling products can be boosted in sales by other products that have a strong association with them through various marketing strategies such as bundling promos, shelf placement, and others. To increase the sales of poorly selling products while addressing stock issues, we performed Market Basket Analysis on the 17 products that are both the least sold and have the highest remaining stock. Based on the analysis we have conducted, here are the significant association rules to be applied in Retail A’s marketing strategy.
                                                              lhs                             rhs    support confidence   coverage      lift count
                                                    {Moisturizer} =>                  {Waist Bag} 0.01259520  0.9347826 0.01347393  5.813020    43
                                                     {Hair Tonic} =>                 {Hair Dryer} 0.03866432  0.8098160 0.04774458  3.388127   132
                                                        {Handbag} =>              {Lemon Shampoo} 0.02665495  0.8348624 0.03192736  1.388996    91
              {Lemon Shampoo, Women's Sling Bag, Canvas Tote Bag} =>            {Girls' Swimwear} 0.01054482  0.9473684 0.01113064 26.083192    36
         {Women's Flap Wallet, Women's Sling Bag, Sunblock Cream} =>                 {Makeup Set} 0.01493849  0.9272727 0.01611013 26.828043    51
                  {Girls' Swimwear, Lemon Shampoo, Mini Backpack} =>            {Canvas Tote Bag} 0.01142355  0.8478261 0.01347393 20.528215    39
 {Women's Batik, Women's Culottes, Kids' T-Shirt - Cartoon Theme} =>            {Whitening Cream} 0.02636204  0.9574468 0.02753368 14.592515    90
Marketing strategy recommendations based on these significant association rules:
- When customers purchase a moisturizer, they tend to also buy a waist bag. We recommend implementing a bundled promotion for these two products, offering a discount.
- When customers purchase a hair tonic, they tend to also buy a hair dryer. We recommend implementing a bundled promotion for these two products, offering a discount.
- When customers purchase a handbag, they tend to also buy lemon-scented shampoo. We recommend placing handbags and lemon-scented shampoo in close proximity—either on the same shelf or on adjacent shelves.
- Girls’ swimwear is often purchased alongside lemon-scented shampoo, a women’s sling bag, and a canvas tote bag. We suggest offering the lemon-scented shampoo for free as part of a bundle containing these four items. With a total bundle price of 318,000 and the shampoo priced at 39,000—representing approximately 12% of the total bundle value—this promotion is a reasonable approach to boost sales of the less popular items included in the set.
- Makeup sets are frequently purchased together with women’s flap wallets, women’s sling bags, and sunblock cream. Given the observed strong association between personal care products (moisturizers, sunblock, etc.) and bags (waist bags, handbags, etc.), we recommend positioning the personal care category shelves near the bag category shelves.
- Regarding the fourth recommendation, the women’s sling bag in the bundle could be replaced with a mini backpack.
- Whitening cream is often purchased alongside women’s batik clothing, women’s culottes, and children’s t-shirts featuring cartoon themes. We recommend implementing a bundled promotion for these four products, offering a discount.
Profit Analysis
Now, we will break down in detail the profits earned by this retail business. The retail owner felt that their profits were very minimal over the past 6 months. This is evident from the financial reports regarding the total revenue, expenses, and profits during these past 6 months (April to September 2023).
| Revenue | Product Sales (Including VAT) | IDR 4,001,485,000 |
| Customer Shipping Fees | IDR 206,932,000 | |
| Total Revenue | IDR 4,208,417,000 | |
| Fixed Costs | Store Rent | IDR 218,700,000 |
| Total Employee Salaries | IDR 204,000,000 | |
| Operations & Equipment Depreciation | IDR 28,100,000 | |
| Insurance | IDR 5,820,000 | |
| Variable Costs | Product Purchases | IDR 2,895,625,500 |
| Product Shipping | IDR 291,066,000 | |
| Packaging and Labeling | IDR 23,583,500 | |
| Marketing | IDR 40,500,000 | |
| Input VAT + Output VAT + Income Tax | IDR 455,202,253 | |
| Total Costs | IDR 4,162,597,253 | |
| Revenue-to-Cost Ratio | Total Revenue / Total Costs | 1.011 |
| Total Profit | Total Revenue - Total Costs | IDR 45,819,747 |
| Average Monthly Profit | (Total Revenue - Total Costs) / 6 | IDR 7,636,625 |
From these financial reports, a revenue-to-cost ratio greater than 1 indicates that this retail business was profitable over the past 6 months. This is proven by the calculated total profit being positive, amounting to IDR 45,819,747, or an average of IDR 7,636,625 per month. However, this profit is very minimal for the retail owner. This shows that it is crucial for Retail A to implement the marketing strategies we have outlined in order to boost its revenue, sales, and profits.
In addition, we will identify products that deserve to have their stock increased based on the consideration of remaining stock and the total profit generated by each product. Take a look at the following image.
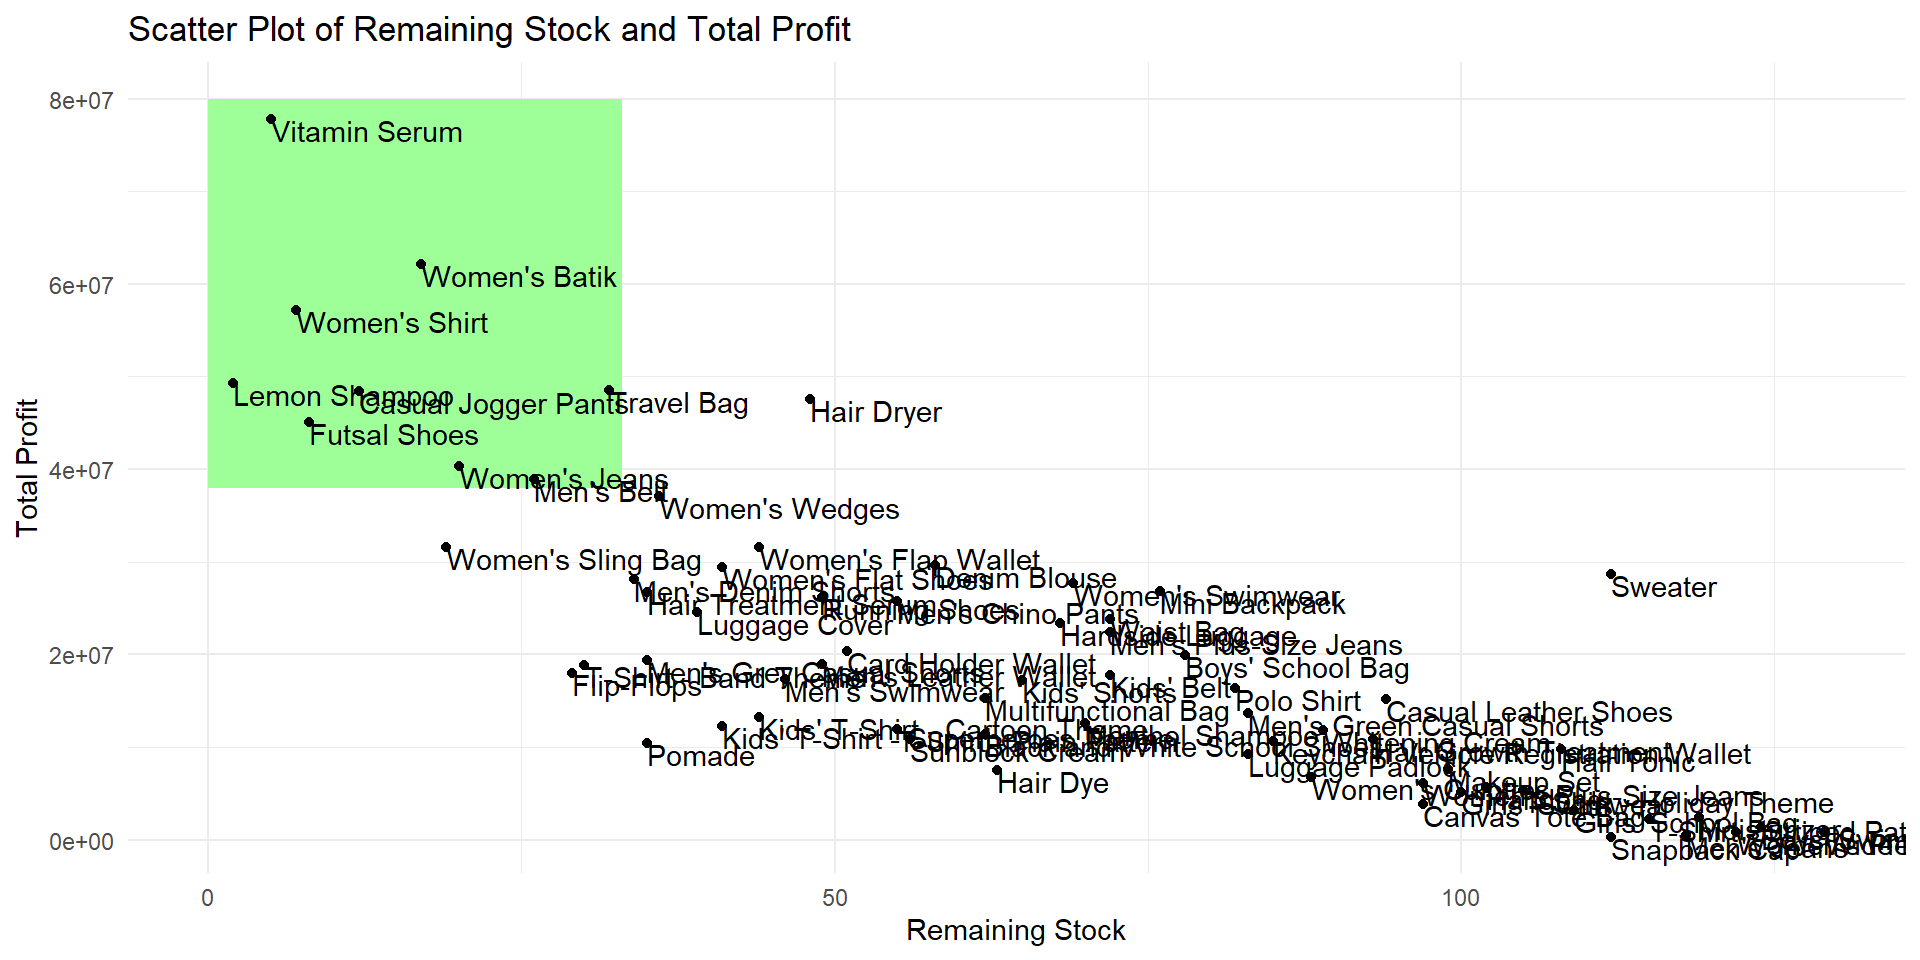
Products that deserve to have their stock increased are located in the green-highlighted area, which represents the highest total profit with the least remaining stock. Therefore, the products whose stock should be increased are Vitamin Serum, Women's Batik, Women's Shirt, Lemon Shampoo, Casual Jogger Pants, Travel Bag, Futsal Shoes, Women's Jeans, and Men's Belt.
By presenting this portfolio, we want to demonstrate our seriousness in providing analysis to help you improve your business performance. Contact us today to maximize the potential of your sales data using our Retail Transaction Analysis service—take advantage of our massive promotion right now, featuring a 50% discount and a free initial consultation!
 WhatsApp Us
 Email Us


