


An airline (Airline X) wanted to better understand its economy-class customers and their satisfaction with different aspects of the service. The study surveyed 346 customers who had flown with the airline. Responses covered customer profiles and satisfaction feedback.
List of Contents
Data Overview
To analyze the survey results, we first need to familiarize ourselves with the data. Below are the survey data and their explanations. (Note: Smartphone users can scroll through text boxes and tables, and zoom in on images if any details are hard to read.)
- Gender: Customer’s gender (Male or Female).
- Age: Customer’s age (in years).
- SC: Customer feedback regarding satisfaction with seat comfort.
- FB: Customer feedback regarding satisfaction with food and beverages provided during the flight.
- WS: Customer feedback regarding satisfaction with in-flight Wi-Fi service.
- E: Customer feedback regarding satisfaction with in-flight entertainment.
- OS: Customer feedback regarding satisfaction with online support experienced while using the airline’s services.
- OB: Customer feedback regarding satisfaction with online boarding.
- CA: Customer feedback regarding satisfaction with the overall attitude of the airline crew.
- BH: Customer feedback regarding satisfaction with baggage handling.
- C: Customer feedback regarding satisfaction with cleanliness.
- OTB: Customer feedback regarding satisfaction with the ease of booking tickets online.
The values in the columns indicating satisfaction levels range from 1 to 5, where 1 signifies ‘very dissatisfied’ and 5 signifies ‘very satisfied’. However, a value of 0 is also used to indicate that a customer is ‘unable to rate’ an item, as they feel they lack sufficient experience to provide a rating for that specific column (aspect).
Data Preprocessing
Data preprocessing aims to organize data prior to processing (analysis) in order to enhance the quality of the analysis results. In this project, preprocessing involved removing rows containing a value of 0 (zero), as customers who entered 0 in the survey would not be valid candidates for inclusion in the data analysis.
    Checking Row that Contain 0 (Zero)
    ----------------------------------
    There are 23 rows that contain zero.
    Preview (10 rows out of 23) :
        Gender Age SC FB WS E OS OB CA BH C OTB
    2   Female  38  5  0  2 4  2  2  4  5 4   2
    33    Male  50  3  3  0 0  1  1  4  4 5   1
    38    Male  35  1  0  4 2  1  4  3  5 3   4
    45  Female  52  0  2  4 5  4  4  3  5 2   4
    46  Female  24  4  2  0 3  1  1  1  3 3   1
    47    Male  33  1  3  5 0  5  5  5  3 5   5
    63  Female  64  4  0  4 1  5  5  2  2 2   2
    85    Male  34  3  4  4 0  4  4  5  5 5   4
    129   Male  22  2  2  0 3  4  4  3  5 5   4
    131   Male  14  3  0  5 0  5  5  1  5 4   5
We removed rows containing zero values, resulting in a dataset of 323 entries. Next, we need to ensure there are no empty data cells (N/A), so we will check for them.
    Counting the Number of NA
    -------------------------
           Number of NA Value
    Gender                  0
    Age                     0
    SC                      0
    FB                      0
    WS                      0
    E                       0
    OS                      0
    OB                      0
    CA                      0
    BH                      0
    C                       0
    OTB                     0
The verification results show no empty cells, indicating the data is in good condition. The data has completed the preprocessing stage and is ready for analysis.
Factor Analysis
Factor analysis is used to identify the underlying factors of the research topic—in this case, customer satisfaction. It also provides indications regarding the validity and reliability of the survey data. Good validity and reliability signify high-quality survey data capable of yielding accurate insights. Presented below are the results of the factor analysis for this research project, along with an evaluation.
    Evaluation of Model Suitability
    -------------------------------
      cfi  agfi rmsea  srmr
    0.970 0.970 0.071 0.068

    Internal Reliability and Construct Validity
    -------------------------------------------
              PngOnl    FasPnb    KnyPmp
    alpha  0.9096355 0.8501808 0.7540334
    omega  0.9116711 0.8632792 0.7541441
    avevar 0.7223532 0.6805679 0.5063909
Interpretation :
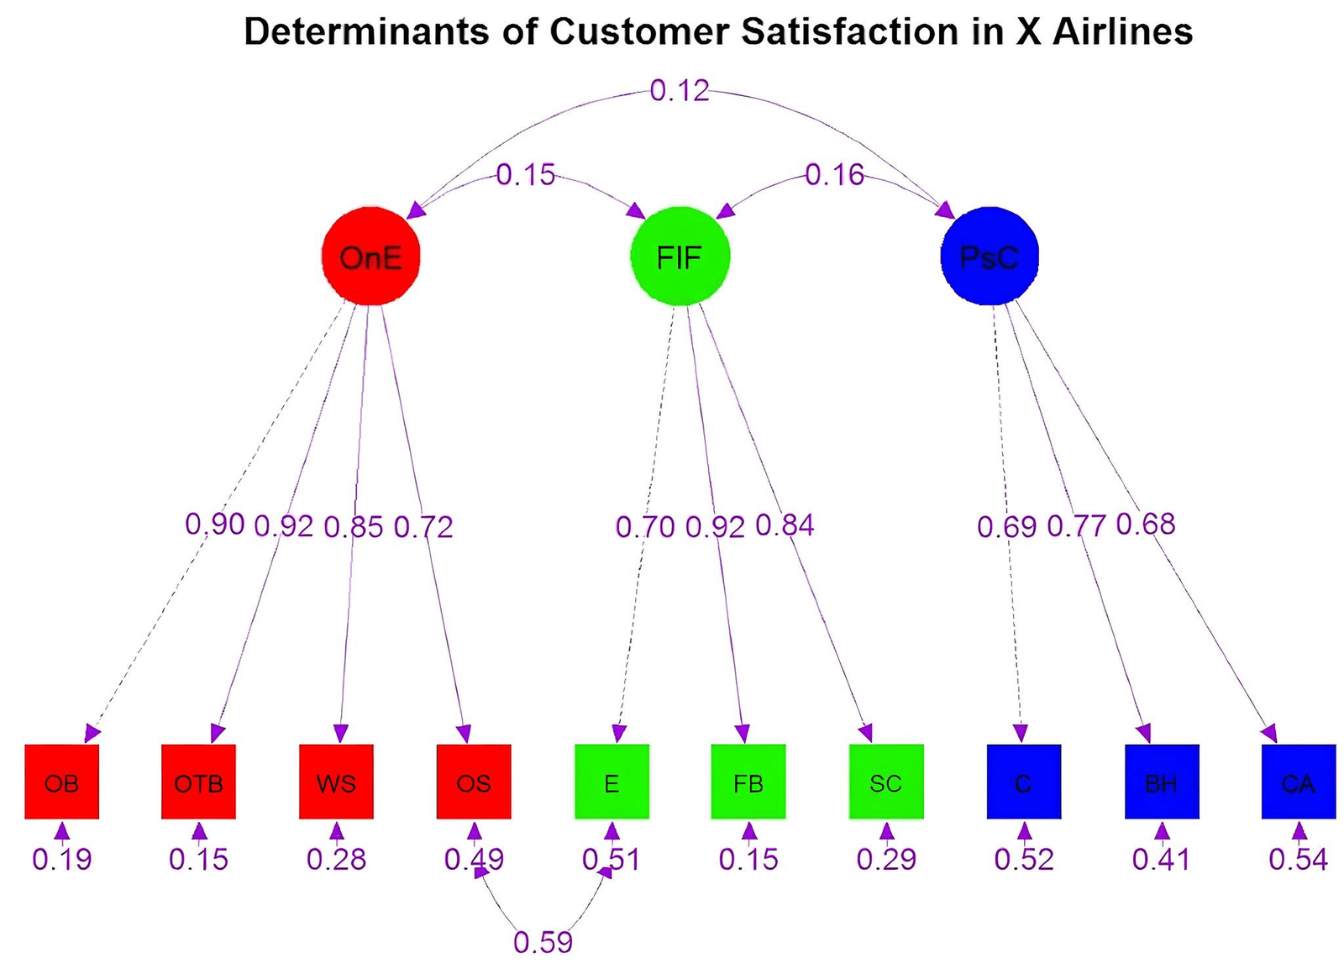
- The ten service aspects can be grouped into three factors. These three factors are Online Experience (OE), Flight Facilities (FF), and Passenger Comfort (PC). These three factors are independent of each other because the covariance between the factors is very weak, namely in the range of 0.12 to 0.16.
- All aspects have a significant influence on customer satisfaction based on their respective factors. This is because the factors are strongly correlated with the aspects within them, namely in the range of 0.68 to 0.92. Therefore, all these aspects are valid to be included in describing customer satisfaction with airline X's services.
- The Online Support (OS) and In-Flight Entertainment (IE) aspects are considered to have a significant positive covariance between the two variables (the value is 0.59). This means that when the Online Support aspect tends to increase, there is a tendency that the In-Flight Entertainment aspect also tends to increase.
-
The calculation results of the fit index show that the model meets the criteria for a good fit with the data.Fit Index Good Criteria Output CFI CFI > 0.900 0.970 AGFI AGFI > 0.900 0.970 RMSEA RMSEA < 0.080 0.071 SRMR SRMR < 0.080 0.068
The calculation results related to validity and reliability show that the survey data is valid and reliable for analysis, so this survey data can be used for further analysis.V/R Type Good Criteria Output Internal Reliability 0.600 < Alpha < 0.950 0.910 ; 0.850 ; 0.754 Construct Validity Omega > 0.700 0.912 ; 0.863 ; 0.754 Construct Validity Avevar > 0.500 0.722 ; 0.681 ; 0.506
Data Exploration
Data Exploration uses simple arithmetic techniques or graphic techniques to provide an overview of the survey results data. In this case, an overview related to the customer satisfaction level of airline X.
-
Distribution of Customer Satisfaction Levels
Interpretation :
-
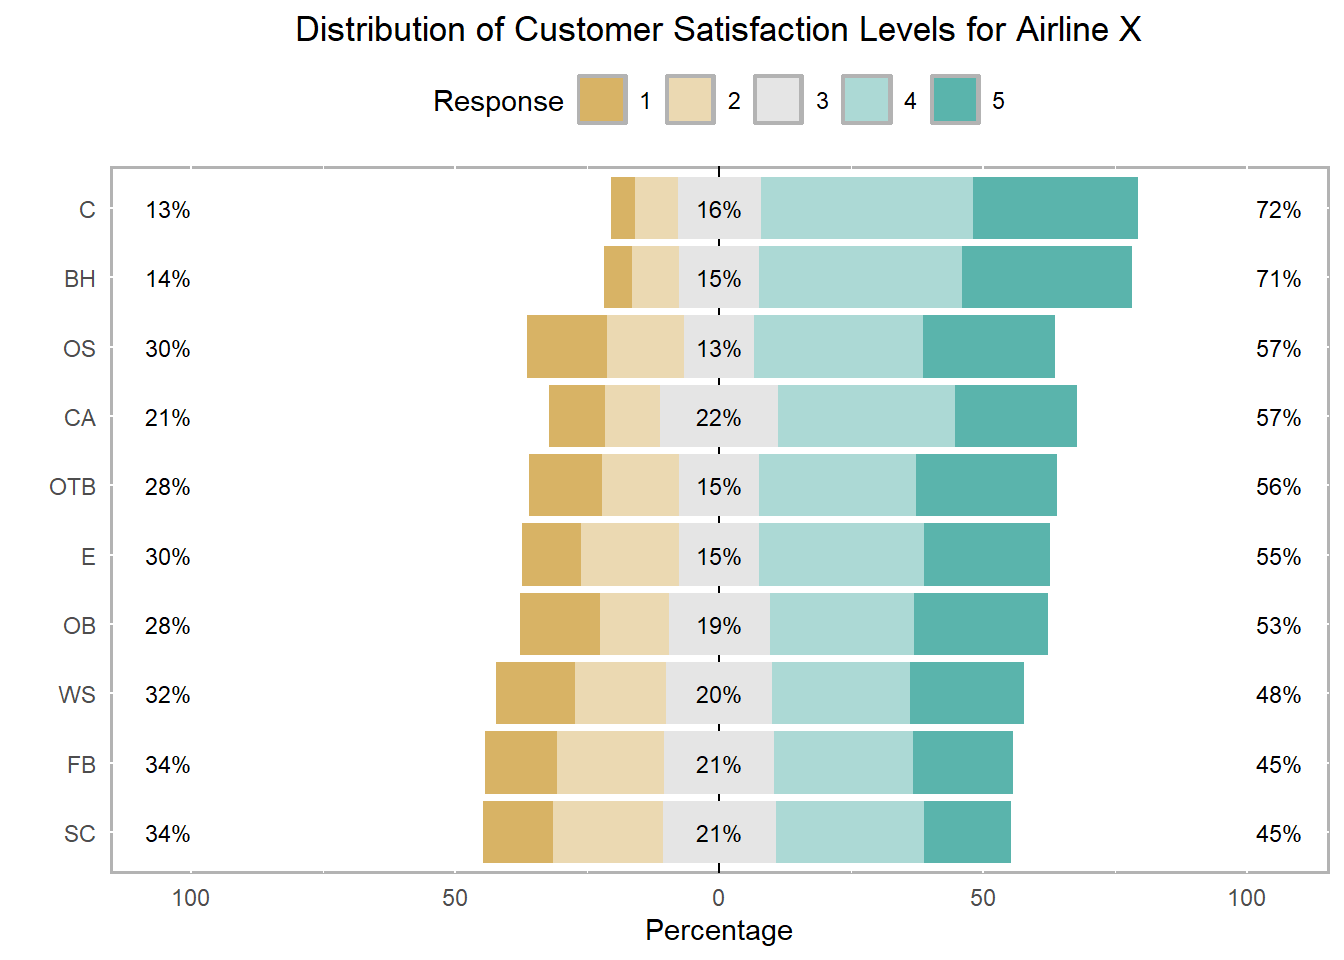
In this bar chart, the percentage figure on the right side indicates the CSAT (Customer Satisfaction Score). This chart shows that the CSAT score of all service aspects in airline X has not met the ACSI (American Customer Satisfaction Index) standard. The ACSI standard for airlines is 75%. The failure to meet the ACSI standard in all aspects indicates that it is very important for airline X to make efforts to improve service quality.
-
Factor Forming Aspects Average CSAT Score Online Experience (OE) OB, KTO, WP, and DO ((53+56+48+57)/4)% = 53.5% Flight Facilities (FF) HP, MM, and KK ((55+45+45)/3)% = 48.33% Passenger Comfort (PC) K, PB, and SK ((72+71+57)/3)% = 66.66% The service with the best quality tends to be in the Passenger Comfort factor because its average CSAT score is the highest, followed by Online Experience, then Flight Facilities as the factor with the lowest average CSAT score. So we suggest tending to improve services in the Flight Facilities factor as the first priority, Online Experience as the second priority, and Passenger Comfort as the third priority.
-
-
Percentage of Satisfied Customers
Interpretation :
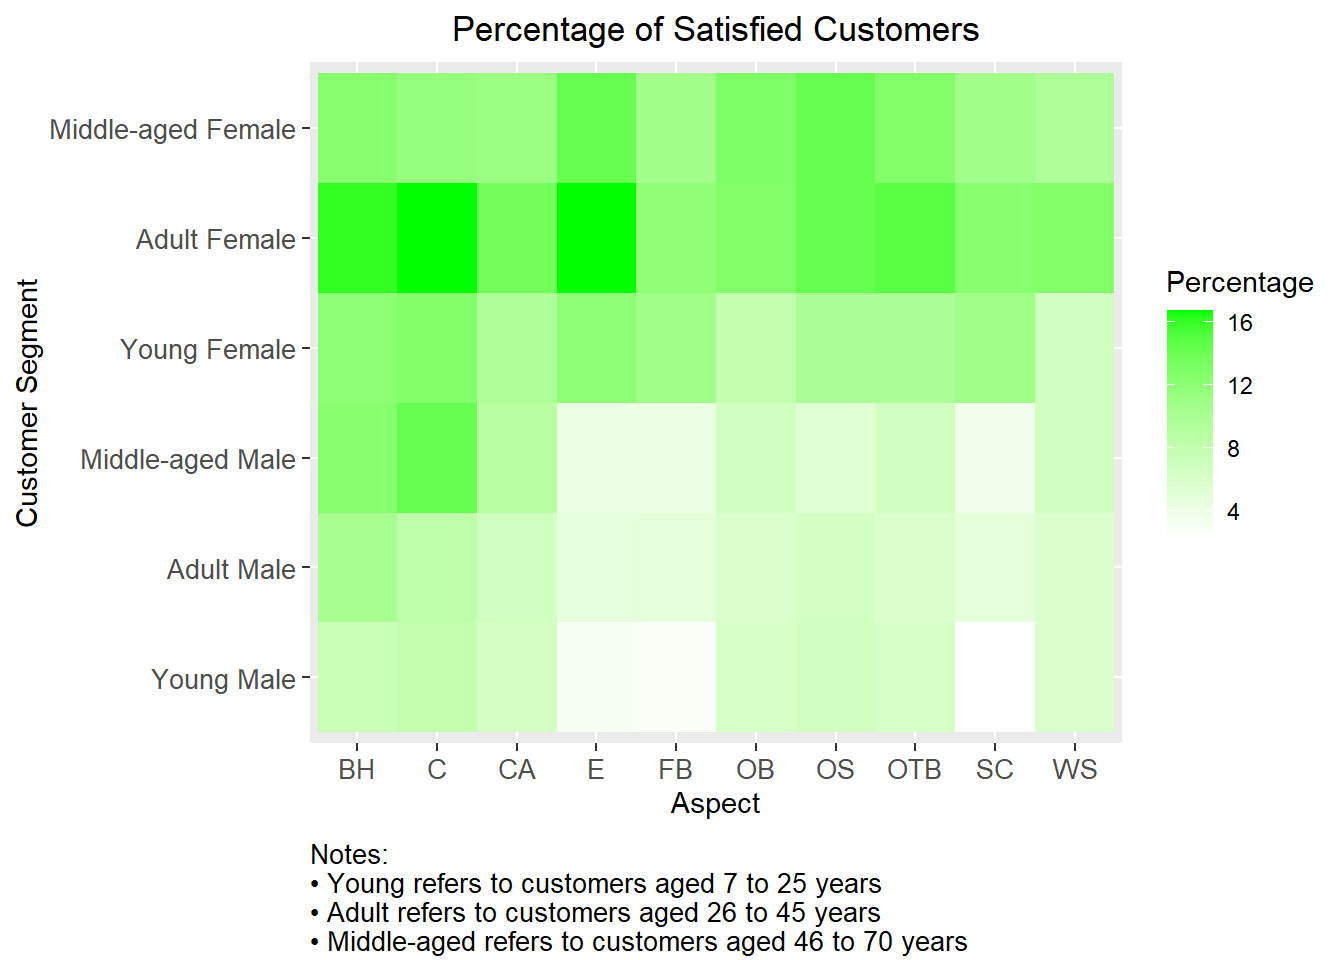
- In this heatmap chart, the greener a box is, the higher the percentage of customers who are satisfied with the service from airline X. This chart shows a tendency that the female group tends to be more satisfied/likes the service provided by airline X than males. Therefore, improving the service quality of airline X by adding something that is a male preference will be a good and efficient effort to increase customer satisfaction.
SWOT Analysis
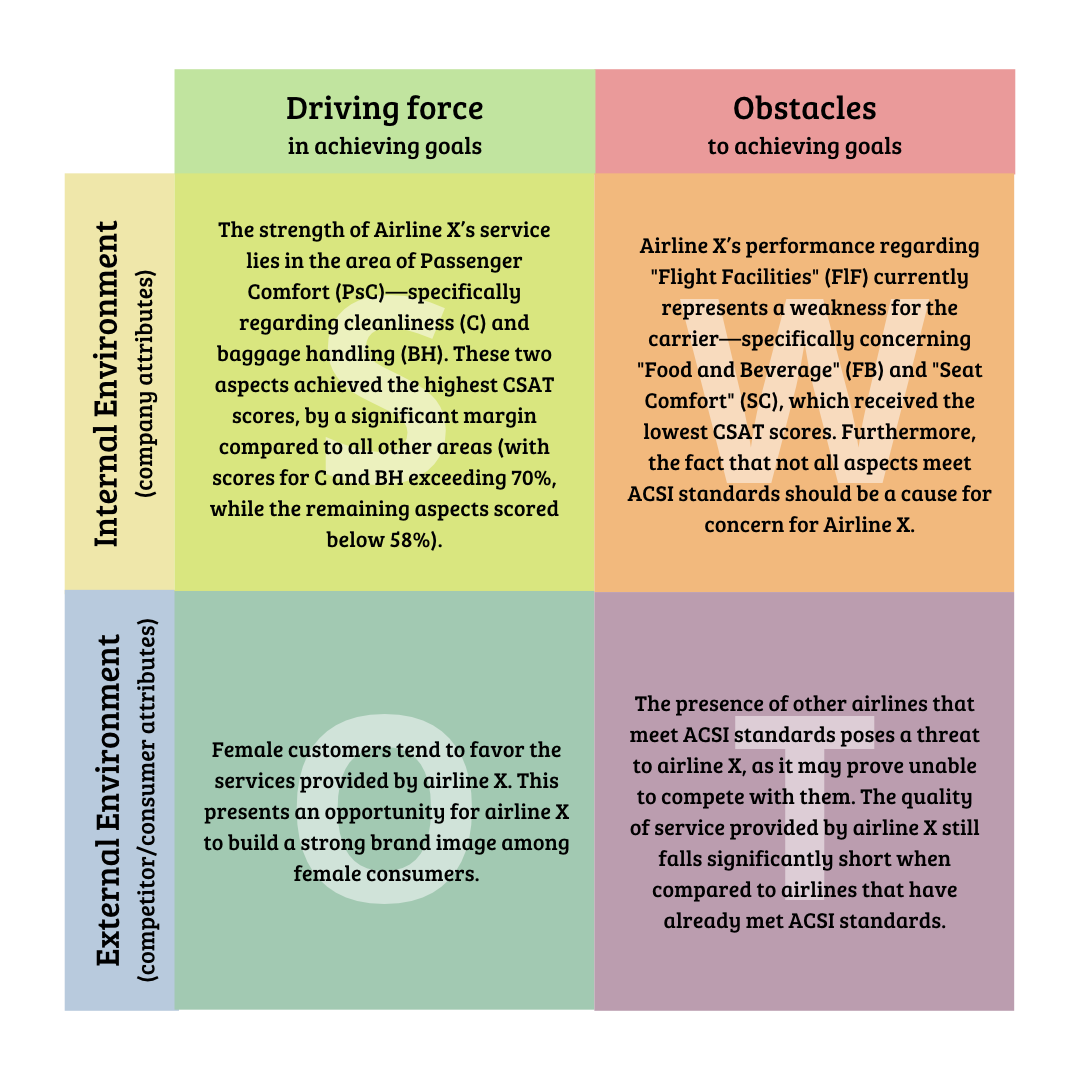
SWOT analysis is a strategic planning method used to monitor and evaluate a company’s internal and external environments in relation to a specific business objective. SWOT is an acronym for strengths, weaknesses, opportunities, and threats. Presented below are the results of the SWOT analysis for this research project.
By displaying this portfolio, we want to show how serious we are in providing analysis to help you improve your business performance. Contact us today to start turning customer satisfaction feedback into insights that can improve your product’s image in the eyes of customers, while we are having a big promo, because we are currently offering a 50% discount and a free initial consultation!
 WhatsApp Us
 Email Us


